S&P500 Trading Update 10/4/26

S&P500 Trading Update 10/4/26
***QUOTING ES1! FOR CASH US500 EQUIVALENT LEVELS, SUBTRACT POINT DIFFERENCE***
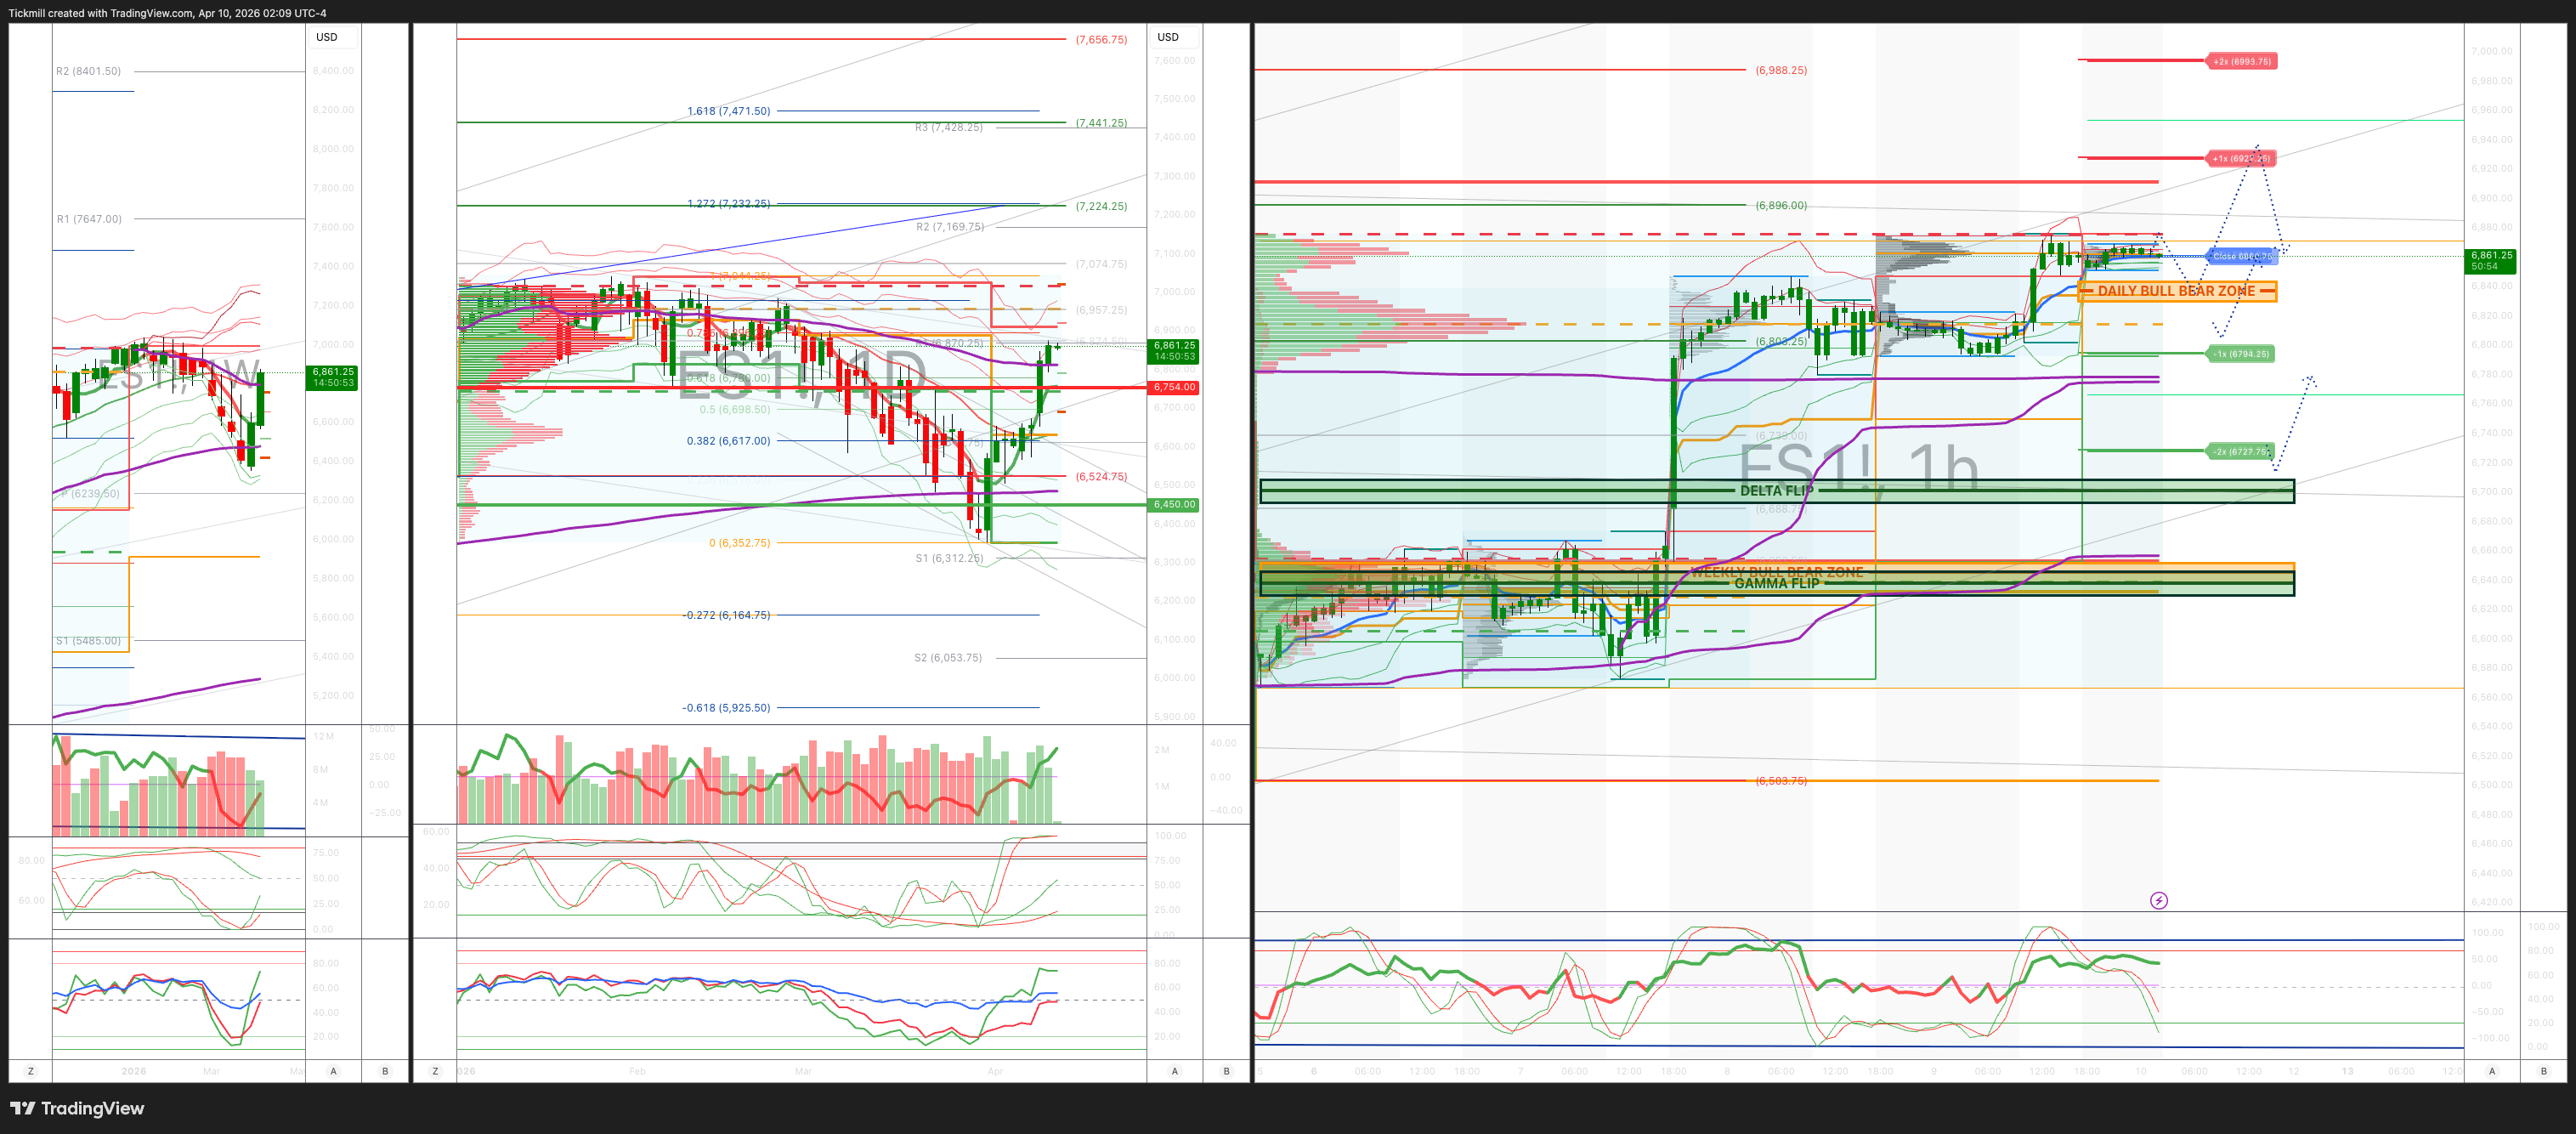
WEEKLY BULL BEAR ZONE 6640/50
WEEKLY RANGE RES 6754 SUP 6450
April OPEX Straddle: 328.55pt range implies a OPEX to OPEX range of [6177, 6835]
June QOPEX Straddle is 546.4pt giving us a range of [5960,7052]
JHEQX Q2 Collar 6189/6290 - 6865/6955
DEC2025 OPEX to DEC2026 OPEX is 945 points giving us a range of [5889,7779]
SPX PUT/CALL RATIO 1.05 (The numbers reflect options traded during the current session. A put-call ratio below 0.7 is generally considered bullish, and a put-call ratio above 1.0 is generally considered bearish)
DAILY VWAP BULLISH 6756
WEEKLY VWAP BULLISH 6591
MONTHLY VWAP BULLISH 6816
DAILY STRUCTURE – OTFH - 6801
WEEKLY STRUCTURE – BALANCE
MONTHLY STRUCTURE - OTFD - 6911
Balance: This refers to a market condition where prices move within a defined range, reflecting uncertainty as participants await further market-generated information. Our approach to balance includes favouring fade trades at the range extremes (highs/lows) while preparing for potential breakout scenarios if the balance shifts.
One-Time Framing Higher (OTFH): This represents a market trend where each successive bar forms a higher low, signalling a strong and consistent upward movement.
One-Time Framing Down (OTFD): This describes a market trend where each successive bar forms a lower high, indicating a pronounced and steady downward movement.
DAILY BULL BEAR ZONE 6840/30
GAMMA FLIP 6638
DAILY RANGE RES 6927 SUP 6794
2 SIGMA RES 6993 SUP 6727
VIX BULL BEAR ZONE 22
TRADES & TARGETS
LONG ON REJECT/RECLAIM OF DAILY BULL BEAR ZONE TARGET DAILY RANGE RES
***ADDITIONAL SETUPS & TARGETS HIGHLIGHTED ON THE CHARTS***
(I FADE TESTS OF 2 SIGMA LEVELS ESPECIALLY INTO THE FINAL HOUR OF THE NY CASH SESSION AS 90% OF THE TIME WHEN TESTED THE MARKET WILL CLOSE ABOVE OR BELOW THESE LEVELS)
GOLDMAN SACHS TRADING DESK VIEW - ‘More Mo’
US equities closed higher, led by broad-based gains across major indexes. The S&P 500 rose 62bps to 6,825, with a $1.2bn buy-side MOC imbalance. The Nasdaq 100 gained 72bps to 25,082, the Russell 2000 advanced 60bps to 2,636, and the Dow added 58bps to 48,186. Trading volume remained muted, with 17.19bn shares exchanged across US equity markets versus a year-to-date daily average of 19.5bn. The VIX climbed 7.37% to 19.49, WTI crude surged 4.70% to $98.83, the US 10-year yield slipped 1bp to 4.28%, gold rose 96bps to 4,764, the DXY fell 31bps to 98.83, and Bitcoin gained 1.44% to $72,407.
The S&P 500 is now on a seven-day winning streak, supported in part by easing geopolitical concerns after comments from Netanyahu on pursuing direct negotiations with Lebanon, alongside reports that Trump is encouraging Israel to scale back its Hezbollah campaign for now. Even so, skepticism continues to weigh on single-stock activity, with US trading volumes running roughly 25% below normal following yesterday’s short-covering rally. Prime brokerage data showed ETF shorts declined 7.4%, marking the largest one-day cover since August 2020 and the third-largest in the past decade.
Pre-war market themes returned to focus, particularly the continued underperformance of Software versus Semiconductors. The Software/Semis pair fell another 7.5%, bringing the weekly decline to 18% and pushing the spread to fresh all-time lows. Both legs contributed to the move, while persistent software supply—mainly from the long-only community—continued to pressure the group.
Desk activity remained subdued. The floor rated overall activity at 5 out of 10, and finished 91bps for sale versus a 30-day average of 69bps for sale. Asset managers and hedge funds were modest net sellers, driven by overlapping supply in tech and pockets of software, partially offset by demand in macro-related products.
Amazon stood out, rising 5.6% for its third-largest one-day gain in the past 12 months, exceeded only by its Q3 earnings reaction and the US-China tariff truce rally last year. The stock is now up 17% from its recent lows over the last eight trading sessions. While the themes from the CEO’s shareholder letter were not entirely new, they reinforced confidence in AI momentum and improved visibility into ROIC. The move also reflected cleaner positioning, rising conviction into earnings, continued AI and token-related momentum, and reduced concern around oil-related cost pressures. Amazon is now back in positive territory year-to-date and trails only Alphabet among the Magnificent 7 in performance.
Systematic flows may remain supportive. CTAs are currently short roughly $30bn of S&P 500 exposure, but model estimates suggest they could buy $34bn over the next week as they cover shorts and flip long. Following yesterday’s rally, all three CTA momentum signals are now positive: short-term above 6,713, medium-term above 6,734, and long-term above 6,400. Yesterday’s S&P 500 MOC imbalance was also a notable $3.8bn to buy, and that trend will be closely watched in the days ahead.
Attention now turns to tomorrow’s CPI release. Expectations are for a 0.28% increase in March core CPI, slightly below the 0.3% consensus, translating to a 2.69% year-over-year rate versus the 2.7% consensus. Headline CPI is expected to rise 0.87%, below the 1.0% consensus, driven largely by sharply higher energy prices. The forecast is also consistent with a 0.23% rise in core PCE for March. Key areas to watch include mixed auto inflation, a benign 0.20% increase in rent but a firmer 0.30% rise in OER, stronger travel services inflation including airfares and hotels, and modest tariff-related upside pressure in exposed categories such as recreation.
In derivatives, the session was relatively steady, though expectations remain for near-term volatility as headline risk persists. At the same time, the technical backdrop is improving as the market moves higher. The overnight vol panic index posted one of its sharpest declines of the year, falling to 8.3 out of 10. As volatility continues to ease, dealers may need to buy delta, potentially enabling clients to add net exposure. Dealers are currently positioned in a pocket of long gamma at these levels. Flow-wise, a large VIX tail hedge was rolled from August into November, while the straddle for the rest of the week went out ~63bps
Disclaimer: The material provided is for information purposes only and should not be considered as investment advice. The views, information, or opinions expressed in the text belong solely to the author, and not to the author’s employer, organization, committee or other group or individual or company.
Past performance is not indicative of future results.
High Risk Warning: CFDs are complex instruments and come with a high risk of losing money rapidly due to leverage. 69% and 73% of retail investor accounts lose money when trading CFDs with Tickmill UK Ltd and Tickmill Europe Ltd respectively. You should consider whether you understand how CFDs work and whether you can afford to take the high risk of losing your money.
Futures and Options: Trading futures and options on margin carries a high degree of risk and may result in losses exceeding your initial investment. These products are not suitable for all investors. Ensure you fully understand the risks and take appropriate care to manage your risk.
Patrick has been involved in the financial markets for well over a decade as a self-educated professional trader and money manager. Flitting between the roles of market commentator, analyst and mentor, Patrick has improved the technical skills and psychological stance of literally hundreds of traders – coaching them to become savvy market operators!