S&P500 Trading Update 7/5/26

S&P500 Trading Update 7/5/26
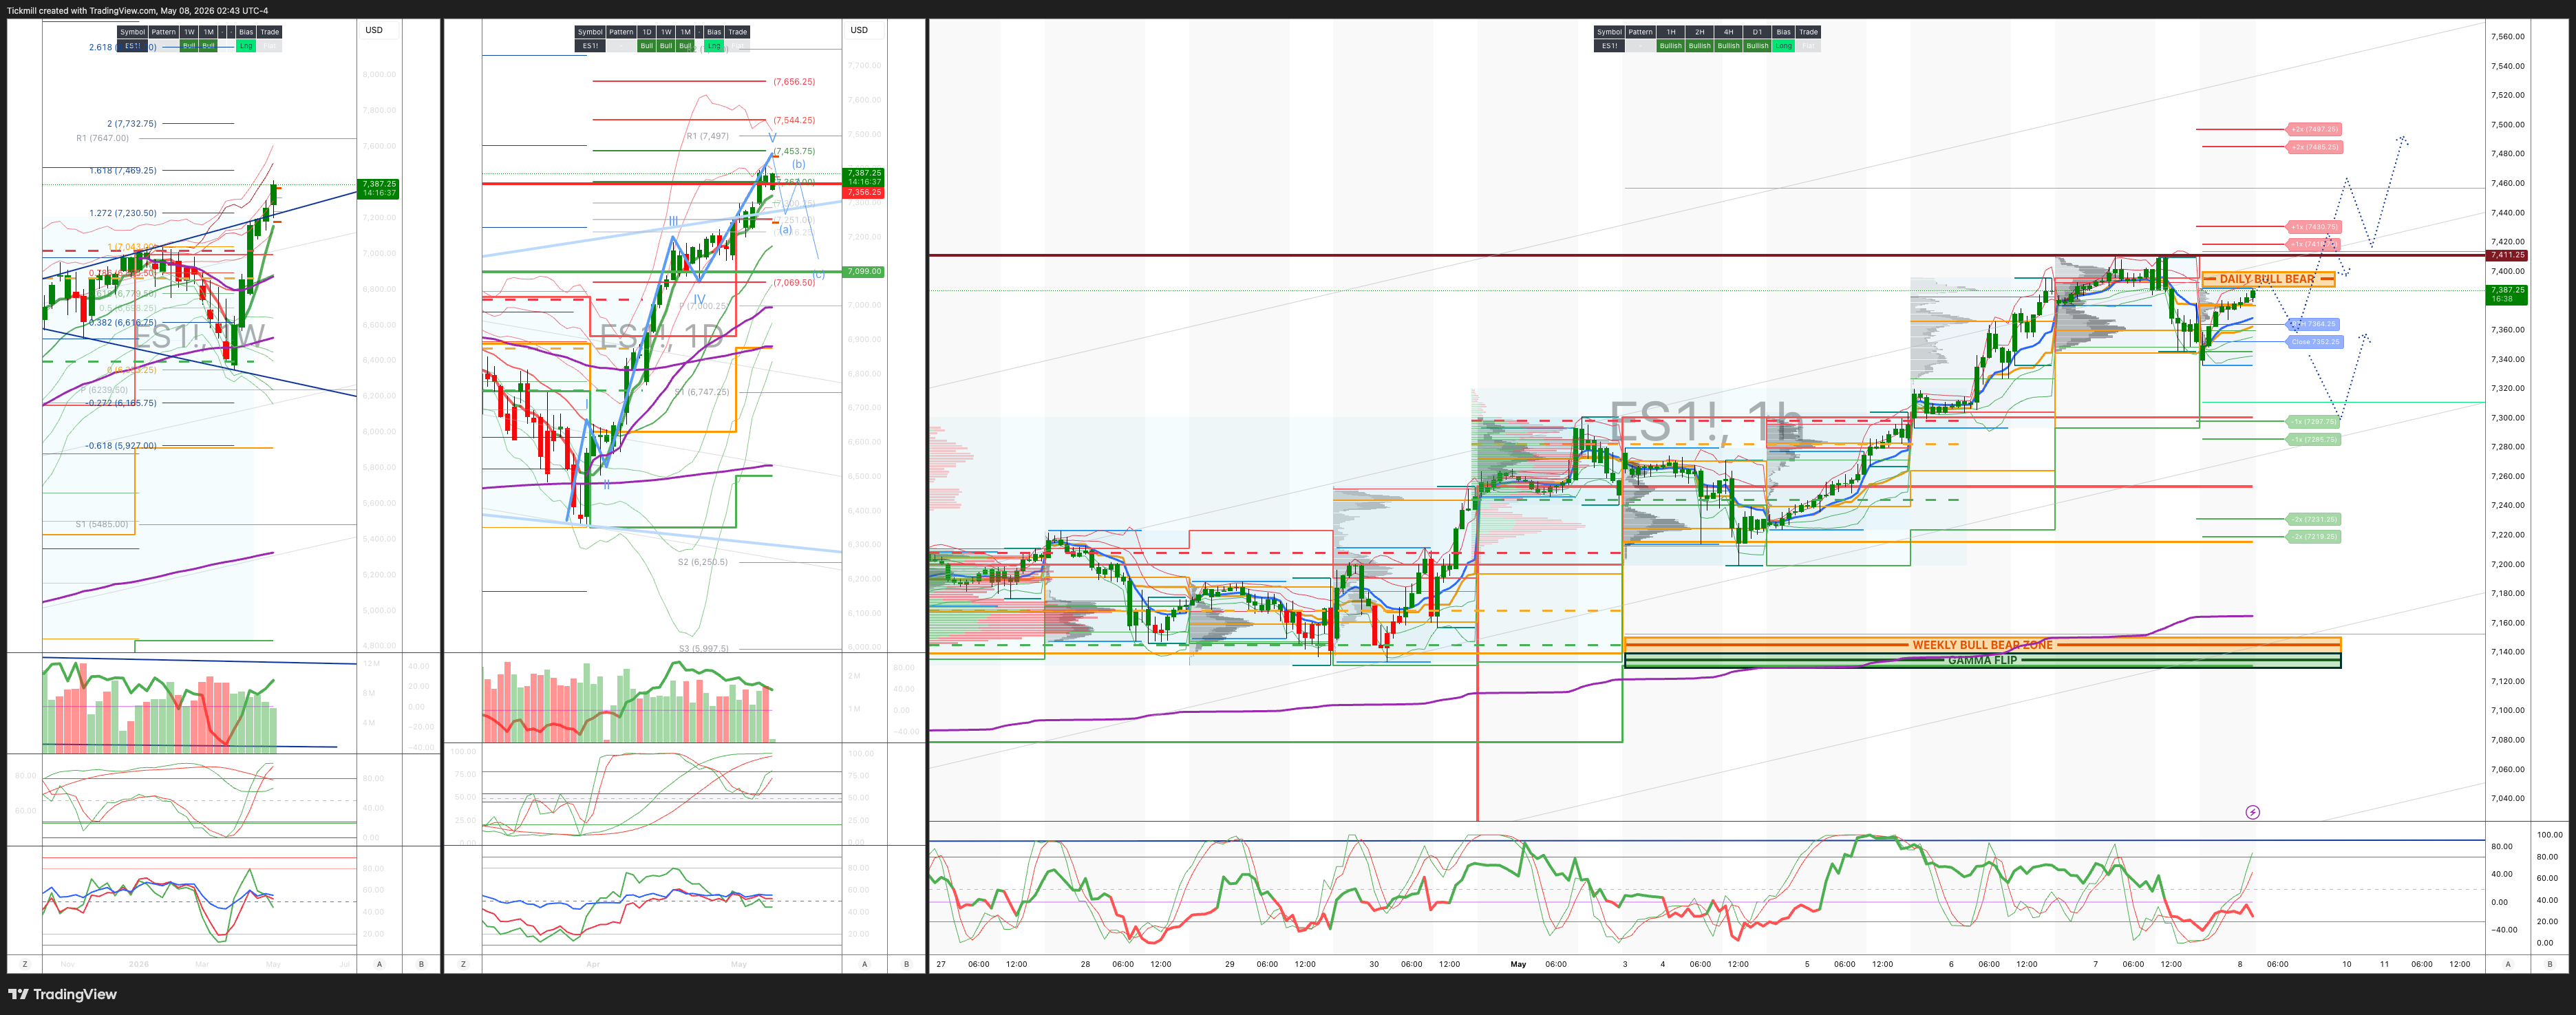
***QUOTING ES1! FOR CASH US500 EQUIVALENT LEVELS, SUBTRACT POINT DIFFERENCE***
WEEKLY BULL BEAR ZONE 7150/40
WEEKLY RANGE RES 7356 SUP 7138
May OPEX Straddle: 225pt range implies a OPEX to OPEX range of [6900, 7350]
June QOPEX Straddle is 546.4pt giving us a range of [5960,7052]
JHEQX Q2 Collar 6189/6290 - 6865/6955
DEC2025 OPEX to DEC2026 OPEX is 945 points giving us a range of [5889,7779]
SPX PUT/CALL RATIO 0.77 (The numbers reflect options traded during the current session. A put-call ratio below 0.7 is generally considered bullish, and a put-call ratio above 1.0 is generally considered bearish)
DAILY VWAP BULLISH 7297
WEEKLY VWAP BULLISH 7118
MONTHLY VWAP BULLISH 6898
DAILY STRUCTURE – OTFH - 7327
WEEKLY STRUCTURE – OTFH - 7137
MONTHLY STRUCTURE - OTFH - 6514
Balance: This refers to a market condition where prices move within a defined range, reflecting uncertainty as participants await further market-generated information. Our approach to balance includes favouring fade trades at the range extremes (highs/lows) while preparing for potential breakout scenarios if the balance shifts.
One-Time Framing Higher (OTFH): This represents a market trend where each successive bar forms a higher low, signalling a strong and consistent upward movement.
One-Time Framing Down (OTFD): This describes a market trend where each successive bar forms a lower high, indicating a pronounced and steady downward movement.
DAILY BULL BEAR ZONE 7370/80
GAMMA FLIP 7030
DELTA FLIP 6950
DAILY RANGE RES 7453 SUP 7320
2 SIGMA RES 7519 SUP 7253
VIX BULL BEAR ZONE 19.5
TRADES & TARGETS
LONG ON TEST/REJECT DAILY BULL BEAR ZONE TARGET DAILY RANGE RES
***ADDITIONAL SETUPS & TARGETS HIGHLIGHTED ON THE CHARTS***
(I FADE TESTS OF 2 SIGMA LEVELS ESPECIALLY INTO THE FINAL HOUR OF THE NY CASH SESSION AS 90% OF THE TIME WHEN TESTED THE MARKET WILL CLOSE ABOVE OR BELOW THESE LEVELS)
GOLDMAN SACHS TRADING DESK VIEW - ‘Tech Led Rally’
US equities ripped higher in a broad risk-on session as Middle East de-escalation headlines triggered a sharp unwind in the oil/rates shock and AMD delivered a major earnings/guidance beat that reignited the AI infrastructure trade. S&P +146bps to 7,365, NDX +209bps to 28,599, R2K +147bps to 2,887, and Dow +124bps to 49,911, with a +$2.5bn MOC buy imbalance and volumes of 19.2bn shares, slightly above the 19bn YTD average. Cross-asset was the key unlock: WTI -677bps to $95.37, 10Y -8bps to 4.35%, DXY -42bps to 98.03, while gold +311bps to $4,699, Bitcoin flat at $81,599, and VIX +40bps to 17.45 despite the index rally. This was the cleanest version of the “oil down / yields down / tech up” playbook, with de-escalation removing the macro ceiling just as AMD gave investors permission to re-risk across semis and AI beneficiaries. Breadth was healthy, with roughly 65% of S&P names higher, and the tone was more “rising tide lifts all boats” than narrow mega-cap squeeze.
The leadership was still tech-first, but the rally broadened meaningfully. AMD +19% was the major catalyst after very strong earnings upside and guidance, helping pull semis and AI infrastructure higher across the board. Institutional tech activity has picked up materially, with gross activity running 2–3x YTD average on the desk in recent sessions. The key flow pattern remains: long-only investors are stopping themselves into different pockets of the AI infrastructure trade, some memory profit-taking is emerging after the sharp run, non-AI tech continues to act as a source of funds, and software is finally seeing more two-way debate after being seller-only for most of Q1. Importantly, the consumer complex also caught a bid as the oil unwind improved the macro read-through for spending. UBER, LYV, SPHR and DIS all traded +5–10%, and this squeeze can continue if crude sustains the move lower, especially given very light positioning after hedge funds sold consumer discretionary in April at the fastest pace in more than four years.
Flows were constructive but not euphoric. Floor activity improved to 6/10, with the desk finishing +2.7% to buy versus a 30-day average of +74bps. Asset managers were net buyers, led by tech. Hedge fund flows were more two-way, with supply in tech, energy and healthcare offset by scattered covering demand across sectors and macro. Both long-only and hedge funds were net sellers of macro products, which fits a market rotating out of broad hedges and back into single-name/secular winners. The takeaway is that the rally had better sponsorship than earlier in the week, but it was still highly concentrated in the same dominant themes: AI infrastructure, semis, selective software and now a positioning-driven consumer squeeze. Energy was the obvious source of funds after the crude collapse.
Derivatives were the most interesting part of the day. The desk saw one of the more active vol sessions of the past few weeks, with the spot-up / vol-up pattern continuing. QQQ vol exploded as the market gained momentum on the breakout rally, and the QQQ/SPX vol spread is now nearly 6 vols wide. That is a notable signal: investors are not just buying equities, they are buying convexity around the tech leadership. Dealer gamma across the Street is viewed as peak long, which should usually dampen short-term realized moves, but demand for front-end tech optionality is overwhelming that effect. Flows showed buyers of short-dated gamma and sellers of term structure. The desk likes buying front-end vol because the curve is too steep, expressed through either calls or puts, while remaining short 1yr skew at current levels. The rest-of-week straddle went out around 78bps, down from prior levels but still leaving room for event/headline risk.
Trading takeaway: stay long risk while oil and yields are falling, but keep the expression focused. The cleanest trade remains AI infrastructure and semi leadership, with AMD’s print validating the demand story and forcing underweight investors back into the complex. That said, after multi-day outsized moves, use call spreads or front-end optionality rather than chasing spot indiscriminately. The second-best trade is the consumer discretionary squeeze if crude holds below $100; positioning is light, the macro impulse just improved, and the read-throughs from UBER/LYV/SPHR/DIS were strong. The most vulnerable areas are energy, crowded hedges and non-AI tech used as funding. In vol, the setup argues for owning short-dated QQQ/SPX gamma around the breakout while selling expensive term structure or longer-dated skew. Bottom line: de-escalation plus AMD shifted the tape back into melt-up mode, and until oil or yields reverse higher, dips in tech and under-owned consumer should be bought.
Disclaimer: The material provided is for information purposes only and should not be considered as investment advice. The views, information, or opinions expressed in the text belong solely to the author, and not to the author’s employer, organization, committee or other group or individual or company.
Past performance is not indicative of future results.
High Risk Warning: CFDs are complex instruments and come with a high risk of losing money rapidly due to leverage. 69% and 73% of retail investor accounts lose money when trading CFDs with Tickmill UK Ltd and Tickmill Europe Ltd respectively. You should consider whether you understand how CFDs work and whether you can afford to take the high risk of losing your money.
Futures and Options: Trading futures and options on margin carries a high degree of risk and may result in losses exceeding your initial investment. These products are not suitable for all investors. Ensure you fully understand the risks and take appropriate care to manage your risk.
Patrick has been involved in the financial markets for well over a decade as a self-educated professional trader and money manager. Flitting between the roles of market commentator, analyst and mentor, Patrick has improved the technical skills and psychological stance of literally hundreds of traders – coaching them to become savvy market operators!