S&P500 Trading Update 1/4/26

S&P500 Trading Update 1/4/26
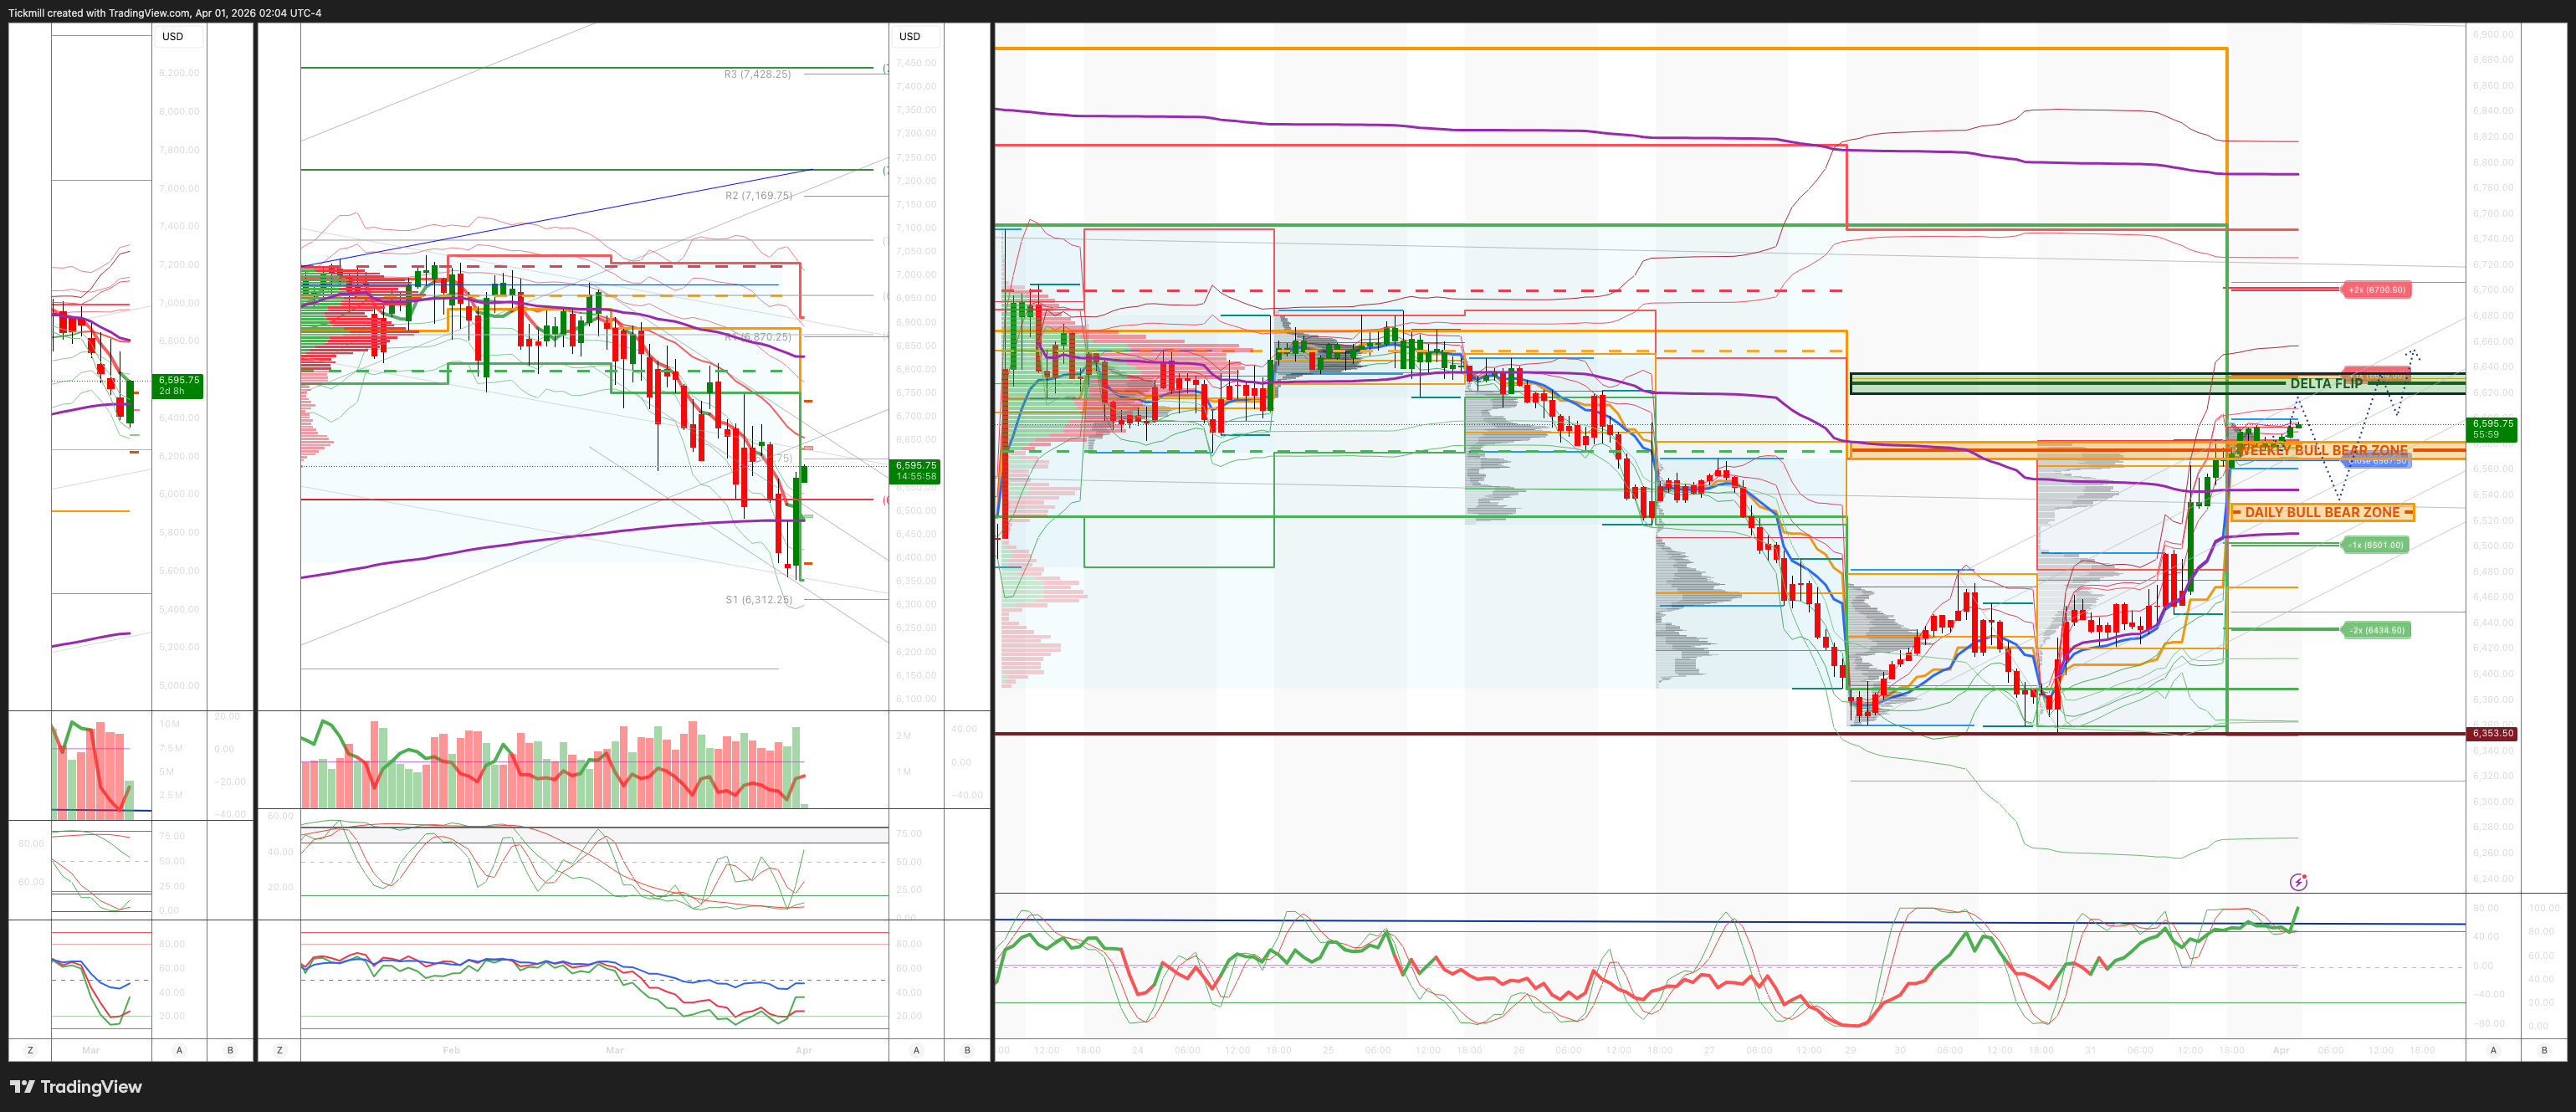
***QUOTING ES1! FOR CASH US500 EQUIVALENT LEVELS, SUBTRACT POINT DIFFERENCE***
WEEKLY BULL BEAR ZONE 6570/80
WEEKLY RANGE RES 6529 SUP 6267
April OPEX Straddle: 328.55pt range implies a OPEX to OPEX range of [6177, 6835]
June QOPEX Straddle is 546.4pt giving us a range of [5960,7052]
JHEQX Q2 Collar 6189/6290 - 6865/6955
DEC2025 OPEX to DEC2026 OPEX is 945 points giving us a range of [5889,7779]
PUT/CALL RATIO 1.11 (The numbers reflect options traded during the current session. A put-call ratio below 0.7 is generally considered bullish, and a put-call ratio above 1.0 is generally considered bearish)
DAILY VWAP BULLISH 6480
WEEKLY VWAP BEARISH 6589
MONTHLY VWAP BEARISH 6816
DAILY STRUCTURE – BALANCE 6622/6359
WEEKLY STRUCTURE – OTFD - 6704
MONTHLY STRUCTURE - OTFD - 6911
Balance: This refers to a market condition where prices move within a defined range, reflecting uncertainty as participants await further market-generated information. Our approach to balance includes favouring fade trades at the range extremes (highs/lows) while preparing for potential breakout scenarios if the balance shifts.
One-Time Framing Higher (OTFH): This represents a market trend where each successive bar forms a higher low, signalling a strong and consistent upward movement.
One-Time Framing Lower (OTFD): This describes a market trend where each successive bar forms a lower high, indicating a pronounced and steady downward movement.
DAILY BULL BEAR ZONE 6530/20
GAMMA FLIP 6628
DAILY RANGE RES 6634 SUP 6501
2 SIGMA RES 6700 SUP 6434
VIX BULL BEAR ZONE 22
TRADES & TARGETS
LONG ON REJECT/RECLAIM OF DAILY BULL BEAR ZONE TARGET DAILY RANGE RES
(I FADE TESTS OF 2 SIGMA LEVELS ESPECIALLY INTO THE FINAL HOUR OF THE NY CASH SESSION AS 90% OF THE TIME WHEN TESTED THE MARKET WILL CLOSE ABOVE OR BELOW THESE LEVELS)
GOLDMAN SACHS TRADING DESK VIEW - De Escalation Hopes
S&P closed up 291 basis points, ending at 6,529 with a Market on Close (MOC) buy imbalance of $7 billion. The Nasdaq 100 (NDX) gained 343 basis points to close at 23,740, while the Russell 2000 (R2K) rose 341 basis points to 2,496, and the Dow Jones Industrial Average (Dow) climbed 249 basis points to 46,342. Total US equity trading volume reached 22.4 billion shares, significantly surpassing the year-to-date daily average of 18.97 billion shares. The VIX dropped 17.5% to 25.25, WTI Crude declined 96 basis points to $101.87, the US 10-year yield fell 3 basis points to 4.32%, gold surged 372 basis points to 4,679, the dollar index (DXY) slipped 68 basis points to 99.82, and Bitcoin advanced 208 basis points to $67,960.
The S&P finished the month and quarter with its strongest performance since last May, fueled by geopolitical developments. Reports indicated Iran’s President Pezeshkian expressed readiness to end the conflict, contingent on guarantees, while former President Trump stated he was open to halting military actions against Iran even if the Strait of Hormuz remained partially closed. Thematic baskets highlighted significant rebounds among year-to-date laggards, with sectors like Quantum, Memes, Software, and the Magnificent 7 collectively recovering approximately $751 billion in market cap since Friday’s close. Hedge Fund VIP versus VIP Short (GSTHVIPP) experienced a challenging month, down 4%—one of the worst 10 monthly performances in the past decade—despite a strong day of outperformance today. Meanwhile, 12-month winners had one of their best days in five years.
Trading activity was moderate, rated a 4 out of 10 on the activity scale, with the floor finishing +874 basis points to buy compared to a 30-day average of -64 basis points. Asset managers showed a bias toward buying, with notable demand in macro, communication services, information technology, and healthcare, while supply dominated in financials and REITs. Hedge fund flows were relatively flat, with covering demand in tech, macro, and industrials offset by supply in energy, discretionary, and REITs. M&A activity saw an uptick, with notable deals including Biogen’s acquisition of Apellis Pharma for $41 per share in cash plus CVR, Lilly’s purchase of Centessa Pharmaceuticals for $38 per share plus CVR, and McCormick’s merger with Unilever’s food operations.
ETF activity remained elevated, with ETFs accounting for 40% of trading volume amid continued heavy shorting activity, according to prime brokerage data. Yesterday’s data revealed net selling in US equities (-1.3 standard deviations from the one-year average), driven by a 4.3-to-1 ratio of short selling to long selling. Macro products were a key driver of net selling (-1.4 standard deviations), with short sales outpacing long sales.
Nike shares declined 5% in after-hours trading despite a modest EPS and revenue beat. Results remain under pressure, with 9-day total company sales down mid-single digits year-over-year, and no signs of a turnaround yet, as anticipated.
On the derivatives front, flows on the volatility desk increased as the month drew to a close, with significant hedges in S&P, NDX, VIX, and ETFs being unwound throughout the day. Volatility levels dropped sharply across the curve as markets rallied on the Iran headlines, while front-end skew saw notable bidding. The S&P experienced one of the largest realized-versus-implied moves in three years, entering today’s session with an implied move of ±1.09% but realizing +2.91%. CTA demand surged, with significant buying interest projected in a +3.5% scenario over the next month, with 6,735 and 6,738 emerging as key short- to medium-term resistance levels in S&P cash terms. The straddle for the remainder of the short trading week closed around 1.32%.
Disclaimer: The material provided is for information purposes only and should not be considered as investment advice. The views, information, or opinions expressed in the text belong solely to the author, and not to the author’s employer, organization, committee or other group or individual or company.
Past performance is not indicative of future results.
High Risk Warning: CFDs are complex instruments and come with a high risk of losing money rapidly due to leverage. 69% and 73% of retail investor accounts lose money when trading CFDs with Tickmill UK Ltd and Tickmill Europe Ltd respectively. You should consider whether you understand how CFDs work and whether you can afford to take the high risk of losing your money.
Futures and Options: Trading futures and options on margin carries a high degree of risk and may result in losses exceeding your initial investment. These products are not suitable for all investors. Ensure you fully understand the risks and take appropriate care to manage your risk.
Patrick has been involved in the financial markets for well over a decade as a self-educated professional trader and money manager. Flitting between the roles of market commentator, analyst and mentor, Patrick has improved the technical skills and psychological stance of literally hundreds of traders – coaching them to become savvy market operators!